Get in touch with Victorystar

Optimize OEE for Food & Beverage: Reduce Downtime on Your Production Line
Contents
show
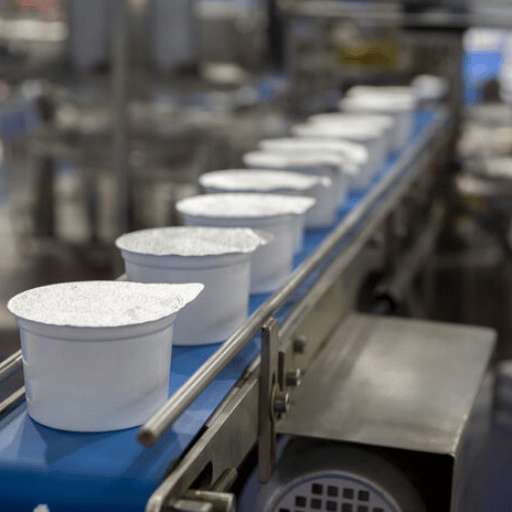
Efficiency in production is the foundation of the food and beverages industry, where minute disturbance results in significant consequences of productivity, profitability, and customer satisfaction. Companies must maximize Overall Equipment Effectiveness (OEE) if they plan to be competitive; nonetheless, unplanned downtime remains one of the most challenging issues manufacturers must confront.
This blog outlines specific strategies for reducing your line’s downtime, thus improving operational efficacy and increasing your OEE quotient. Here, one would surely find this information invaluable for improving the processes and running your factory at full speed, leveraging the best methods that the sector offers.
Key Takeaway
Optimizing OEE requires a balanced focus on availability, performance, and quality. Reducing unplanned downtime through predictive maintenance and real-time data analytics is the most effective way to boost profitability in food and beverage manufacturing.
Understanding OEE in Food and Beverage Manufacturing
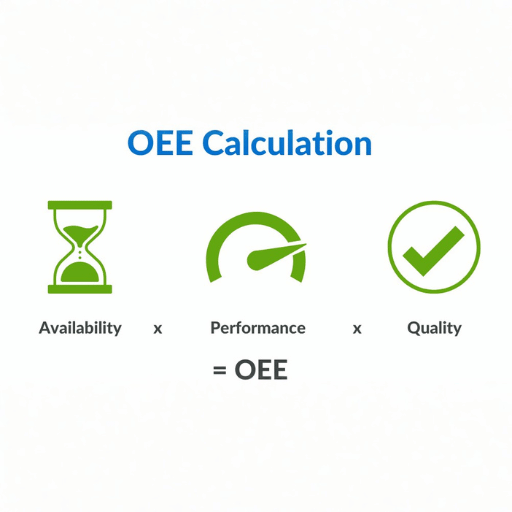
Overall Equipment Effectiveness (OEE) is an important metric in the food and beverage manufacturing industry because it captures the efficiency of the production process by multiplying three measures specifically availability, performance, and quality.
- •
Availability: Signifies downtime losses and readiness. - •
Performance: Reviews the efficiency and speed at which equipment operates. - •
Quality: Calculates the percentage of products meeting defined standards.
By analyzing OEE, producers identify bottlenecks, reduce production wastes, increase productivity, and ensure sustainable high-quality output while also squeezing down operational costs.
What is OEE and Why is it Important?
Overall equipment effectiveness (OEE) is a measure standardized across industries for evaluating and improving the productivity of manufacturing. This is an all-around metric because it joins availability, performance, and quality to an aggregate to represent an overall effectiveness of a set of manufacturing operations.
OEE is significant in exposing inefficiencies like downtimes, subpar performance, and defects so that data-driven decisions can be taken to improve the use of capital. It has helped and has the potential of helping to reduce waste and increasing efficiency in throughput and quality over time. This will lead to achieving operational effectiveness and competitiveness in the market.
Components of OEE: Availability, Performance, and Quality
Availability
Availability is a measure of the portion of the time allotted for the use of equipment and the time during which this equipment is actually running under all kinds of unplanned downtimes like equipment failures, shutoff for maintenance, or setup adjustments. Availability is computed as the ratio of uptime to the total time/cycle, and it provides a measure of readiness of the equipment and scheduling efficiency.
Performance
Performance measures the extent that a piece of equipment runs at its designed speed while factoring in elements such as slow cycles or negligible stops. It is measured as the ratio of the actual output to the theoretical maximum that is achievable at the designed speed of the piece of equipment. This enables us to identify underperformances, revealing the underlying suboptimal process or inefficiencies.
Quality
Quality is the proportion of good products produced as a ratio of the total production, even with defective or nonconforming articles being considered. This is great performance with minimal rework. So, quality management is all about measuring process effectiveness in conforming to production standards, and process preference is a function of waste minimization circumstances. Quality is the direct measure of the user’s needs.
How OEE is Calculated in Food Production
The availability, performance, and quality aspects build the OEE in food production. Availability measures operating hours versus planned hours, therefore accounting for unplanned downtime. Performance measures cycle time to establish how long each cycle takes within the speed line and slow cycle or minor stop loss cycles enhance production speed. Quality on the other hand is quantified in terms of unit specifications to the total units produced.
OEE = Availability × Performance × Quality
The universal formula for identifying production efficiency and improvement areas.
Strategies to Optimize OEE in Beverage Production
- 1
Minimize Downtime
Undertake upkeep of machinery on a regular schedule to avoid unforeseen failures. Installing predictive maintenance systems can nip potential concerns in the bud. - 2
Enhance Production Line Efficiency
Fine-tune equipment settings or streamline layouts to remove time delays. Training operators to fix minor stoppages rapidly can enhance overall productivity. - 3
Improve Quality Control
Use automated inspection systems to catch defects in real time. Analyzing defect trends helps address root causes. - 4
Optimize Scheduling and Demand Planning
Link production schedules with forecasting to reduce overproduction. Ensure materials are staged to avoid resource-related downtimes. - 5
Leverage Data Analytics
Real-time monitoring analysis identifies patterns and performance benchmarks to help resolve bottlenecks.
Identifying and Reducing Downtime in Production Lines
The identification and mitigation of downtime in production lines can be done effectively by sticking to a systematic and data-driven approach. The first step is categorizing downtime into planned and unplanned incidents, which permits scrutiny and review.
Cutting-edge monitoring technology that includes industrial IoT sensors and real-time plant floor software is required for capturing accurate bottleneck and equipment malfunction data. Tools for determining the likely root causes come in handy in addressing recurrent issues. Predictive maintenance strategies, driven by machine learning algorithms, can then forecast shortcomings even before they surface. Also, personnel cross-training and standard operating procedures can help achieve a quick conclusion in the face of downtime. By integrating these methods, the manufacturers are significantly bringing downtime down, ensuring optimal resource use and efficiency.
Implementing Real-time OEE Software Solutions
It is crucial that the real-time Overall Equipment Effectiveness (OEE) software solutions exist in the present-day manufacturing scenarios. These core tools allow for continuous acquisition and analysis of data that operators can use to keep abreast of machine performance, quality, and availability status.
💡
Pro Tip
Use real-time dashboards on the factory floor to empower operators. When teams see OEE scores in real-time, they can react instantly to performance dips before they impact the daily average.
Using this data to analyze and execute decisions controls the bottlenecks and inefficiencies. Software-based enterprises capable of delivering sustainability should shift from reactive to proactive management. Take full advantage of assets, leaving no space for waste. The synchronization of these systems supports permanent optimization historicity, thereby generating a high level of productivity and chunky profitability.
Continuous Improvement Practices for Enhanced OEE
For an improved Overall Equipment Effectiveness (OEE), it is essential to follow structured processes for continuous improvement. Some of the important methods might include Lean techniques like Total Productive Maintenance (TPM) that deter unnecessary downtimes due to preventive maintenance.
A closer look at the operational data and performance management tools project recurring performance loss events, and, therefore, require well-targeted corrective measures. Yet another viable practice is a vigorous Root Cause Analysis (RCA) which identifies centralized issues impacting availability, throughput, or quality. Cultivating a culture of employee engagement and training, meanwhile, helps operators and technicians acquire skills to advance process improvement. The implementation of all of these growth-generating strategies ensures that incremental OEE increases are maintained through time.
Case Studies: Successful OEE Optimization in Food Manufacturers
Case Study 1: Bakery Production Line Upgrade
A medium-sized bakery had troubles in terms of production backlogs triggered by unscheduled equipment breakdowns and changeover time delay. By implementing a real-time OEE system, the bakery identified the specific culprit machine causing frequent breakdowns. Maintenance schedules were optimized and operators were trained in quick changeovers. Within six months, the company saw a 15% increase in productivity.
Case Study 2: Dairy Plant Process Improvements
One dairy producer was up against extended equipment blank times and too much waste during packaging. By bringing in automated monitoring systems and fixing their SOPs, the plant increased equipment utilization and reduced material waste by 20%. This led to a 10% improvement in OEE and improved cost efficiency.
Case Study 3: Snack Food Manufacturer’s Preventive Maintenance Plan
A snack foods manufacturer experienced frequent interruptions due to aging equipment. By implementing predictive analytics for preventive maintenance, they reduced unscheduled downtime by 30% and increased machinery reliability by 12%, empowering operators through real-time monitoring.
Examples of OEE Improvement in Beverage Companies
Proof of higher OEE in beverage companies was seen with their adoption of tailored production systems and data analytics. Anticipatory traction, like predictive maintenance, prevents equipment failures that would otherwise interfere with smooth production flow.
Their equipment management through an influx of sensor and IoT-monitoring technologies enhances the fast pinpointing of inefficiencies and bottleneck attributions on production lines that can be got rid of immediately. Additionally, automating quality checks keeps the production flow system from falling into defective-waste traps; both of these strategies are OEE-improvers that add to overall sustainable growth and customer satisfaction in the very competitive beverage industry.
Lessons Learned from OEE Implementation in Food Processing
- ✓
Data-Driven Decision Making: Precise identification of underused machinery is made possible by accurate real-time data. - ✓
Cross-Functional Collaboration: Interaction among production, maintenance, and quality teams ensures smooth operations. - ✓
Technology Adoption: IoT and predictive maintenance tools are the fastest ways to minimize downtime. - ✓
Employee Training: A workforce that understands OEE metrics contributes meaningfully to continuous improvement.
Quantifiable Benefits of Optimizing OEE
Optimization of OEE very tangibly facilitates operational gains upon efficiency and profitability. As an increase in the efficiency of assets leads to an increase in the efficiency of equipment as well, this is manifested in an increase in the throughput while avoiding capital expenditure.
Minimizing downtime and increasing process performance lead to less operating costs from less idle time, waste, and unplanned maintenance. Simultaneously, improved quality reduces defect-related losses and improves satisfaction in the eyes of customers. In sum, those gains produce a higher return on assets (ROA) and further competitive strength within the market.
Key Metrics for Monitoring OEE Performance
| Metric | Focus Area | Primary Goal |
|---|---|---|
| Availability Rate | Downtime & Breakdowns | Maximize Uptime |
| Performance Efficiency | Speed & Cycle Times | Eliminate Micro-stops |
| Quality Rate | Defects & Rework | Zero Waste |
Understanding OEE Score and Its Implications
OEE is a comprehensive metric for the appraisal of manufacturing operations’ efficiency and productivity. A high OEE percentage indicates that equipment is used to its optimal capacity with minimum downtime, efficient production rates, and high-quality output.
Indicator concerns arise at the bottom of the OEE score: Operations-related elements requiring closer scrutiny include prolonged machine downtime, long cycle times, and higher-than-expected damages. By a breakdown of the components of OEE, organizations will be able to give priority to corrective measures and develop focused strategies for closure of any fissure that leads to quick improvements.
Changeover Times and Their Impact on OEE
Each changeover directly affects the overall equipment performance. If the changes take longer than expected, the availability performance is lower. Unscheduled turndown of the machine due to ever-increasing changeover time will negatively affect OEE ratings.
Using good changeover methods such as Single-Minute Exchange of Dies (SMED) considerably reduces downtime experienced by the equipment and improves availability. An efficient changeover would mean increased per-unit saving and speed to get through, without any upheaval in the workflow, also using full resource potential. The reduction of changeover times is a key strategy to increase operational efficiency while maintaining a high level of OEE performance.
Tracking OEE Metrics for Continuous Improvement
The tracking of OEE metrics necessitates a systematic and data-driven approach to secure an ongoing enhancement in operational efficiency. In order for companies to be able to gather data pertaining to the three components, namely, Availability, Performance, and Quality, it is essential that they engage and use a real-time tracking system to provide accurate capture of information.
⚠️ Important Note
OEE tracking is not about punishing workers for downtime; it’s about uncovering systemic issues. Focus on a culture of improvement rather than blame to get the most accurate data from your team.
Assessing these metrics allows companies to identify continuous or on-again-off-again bottlenecks, inefficiencies, or problems in the area of quality. Use of benchmarks set by monitoring OEE trends helps in making a comparative analysis between any new process changes and what influence such process pegs have on the operational regime. With the introduction of OEE tracking into daily operations and a change in culture that encourages continuous assessment, companies are able to maintain and build upon long-term productivity gains and remain competitive in their industry.
Reference Sources
- Shoplogix: Insights on OEE calculus for optimal efficiency.
- Paterson Consulting: OEE grading targets for food and beverage.
- Food Engineering Magazine: Strategies for maximizing OEE on production lines.
- LineView: Performance analysis for aseptic lines.
- Festo: Operational practice for effective beverage production.
Frequently Asked Questions (FAQs)
What is OEE in beverage production?OEE stands for Overall Equipment Effectiveness, a metric used to gauge and improve the productivity and effectiveness of a beverage production line.
Why is OEE Important for the Production of Beverages?It dramatically eliminates areas of inefficiency, reduces downtime, and establishes qualitative steps that lead to overall profit improvement.
What are the main components of OEE?The three main components are Availability, Performance, and Quality.
How can manufacturers increase OEE in Beverage Manufacturing?Improve OEE by reducing equipment downtime, sorting out errors in production speed, and ensuring products meet quality standards consistently.
What are the tools available for Beverage producers to track OEE?Software solutions, such as real-time OEE monitoring systems and IoT sensors, are the most common ways of tracking and enhancing OEE metrics.

Candy
Articles: 37
Trending now